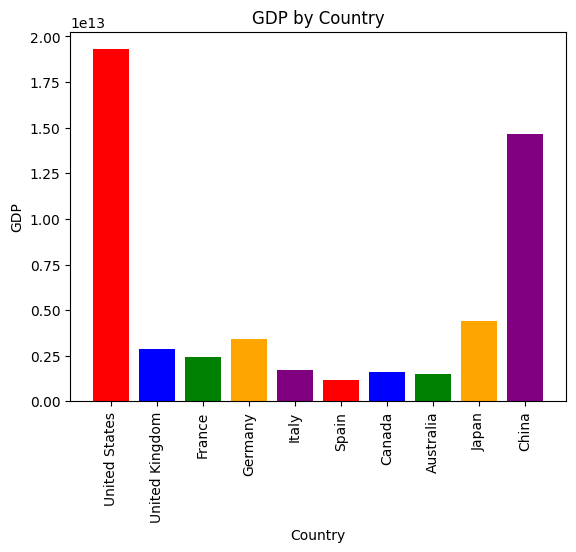
假如你有一个需求:Plot the histogram of countries showing for each the gpd, using different colors for each bar
翻译过来是:绘制每个 gpd 显示的国家直方图,每个条使用不同的颜色
如何快速得到下面的图:

https://github.com/gventuri/pandas-ai
这个库就是干这个事情的
pandas_ai(
    df,
    "Plot the histogram of countries showing for each the gpd, using different colors for each bar",
)
其实就是把ChatGPT和Pandas结合了,不用写代码,直接自然语言进行数据分析并且生成漂亮的图表满足你的需求。
 全部评论: 0 条